Understanding Normal ECG Ranges: ECG Test at Home
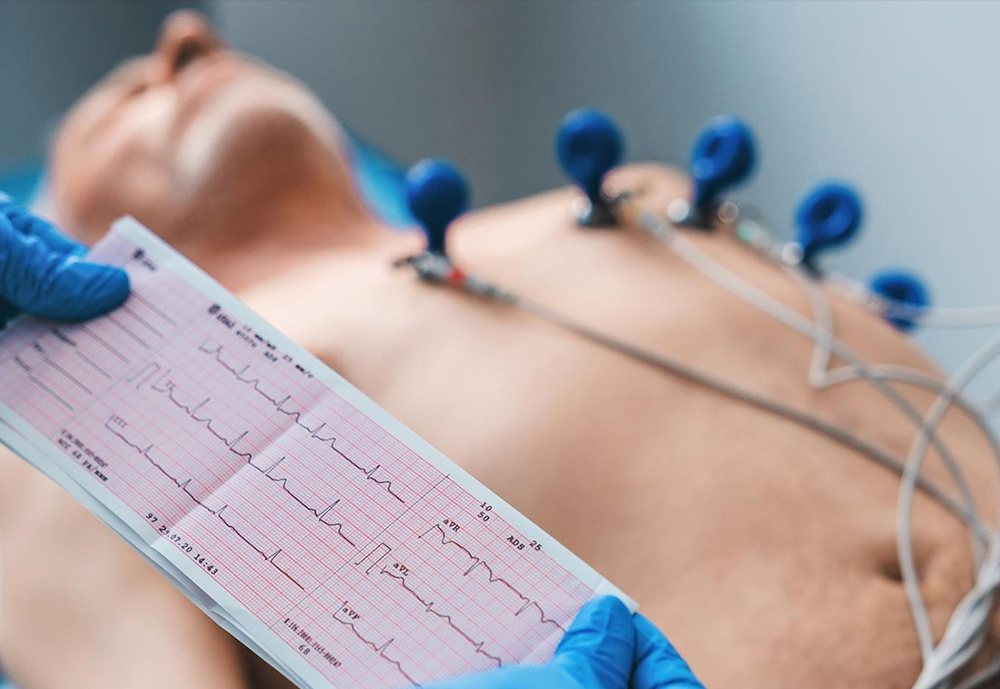
When a doctor asks for an ECG, many people picture those small sticky electrodes placed on the chest and the wave-like lines printed out on paper. To most patients, those lines look confusing, almost like a foreign language. But to a trained eye, every bump, dip, and interval has meaning. The question most patients have is simple: what does “normal” really look like? With ECG tests at home in Gurgaon, you will not have the hassle of running from pillar to post in the hospitals anymore. 24med.care has simplified this for you with ECG services at your doorstep.
Heart Rate and Rhythm
The first thing an ECG shows is the rhythm of the heart. In healthy adults, the resting heart rate usually falls between 60 and 100 beats per minute. When the pattern is steady and every beat follows a regular sequence, doctors call this a normal sinus rhythm. This is the baseline of a healthy tracing. If the rate drops below 60, it is known as bradycardia. If it jumps above 100, that is tachycardia. Both can be normal in certain situations. For example, in athletes who may naturally have a slower heart rate, or during exercise when the rate climbs. However, outside those cases, they can point to an underlying condition.
The Importance of Intervals
Beyond the rhythm, doctors measure the time it takes for signals to travel through the heart. This is what is termed as intervals and marks different phases of each heartbeat.
The interval called PR takes into account how much time the electrical signal takes to move from upper chambers of the heart to lower ones. Usually, this takes around 120 to 200 milliseconds. Any duration longer or shorter than this could highlight that the signal is delayed or is moving very quickly.
Another measure is the QRS durations which shows how fast the ventricles contract. This should be under 120 milliseconds while the QT interval shows how the time it takes for ventricles to contract and then reset to the next beat.
Waves and Segments
An ECG is also judged by the shape of its waves. Each bump has a purpose. The P-wave, which comes before the larger spike of the QRS complex, represents the atria contracting. In a normal ECG it is small and rounded, usually less than 2.5 millimeters in height.
The ST segment, the flat stretch that follows the QRS, is especially important. Ideally it should sit level with the baseline. If it is elevated or depressed, doctors start thinking about possible heart muscle strain or reduced blood supply.
Then comes the T-wave, which shows the heart recovering between beats. A healthy T-wave is upright in most leads, although there are safe exceptions, such as in lead aVR. If the T-wave looks inverted or unusually tall, it can be a clue that something is off.
Why These Numbers Matter
It is easy to get lost in the small details of an ECG, but every one of these ranges tells part of the story. A heart rate that is too fast, an interval that runs too long, or a wave that looks different than expected can all point to changes in the heart’s function. On their own, you do not have to worry about small variations. However, when they are combined with symptoms of other test results, they present a clearer picture.
At 24med.care, we provide ECG at home so that you do not have to worry about anything. With this guide in place, you do not have to rely on a healthcare professional alone to interpret the whole picture. Get in touch with us now to learn more about the same.


